
Thanks for reading Part 1. I got so much feedback and engagement from it, and I’m honestly very happy that so many people resonated with what I’m building. For me, the biggest win is simple: I love solving problems, and now I’m glad some of those solutions may help other people too.
If you haven’t read Part 1, here is the very short version.
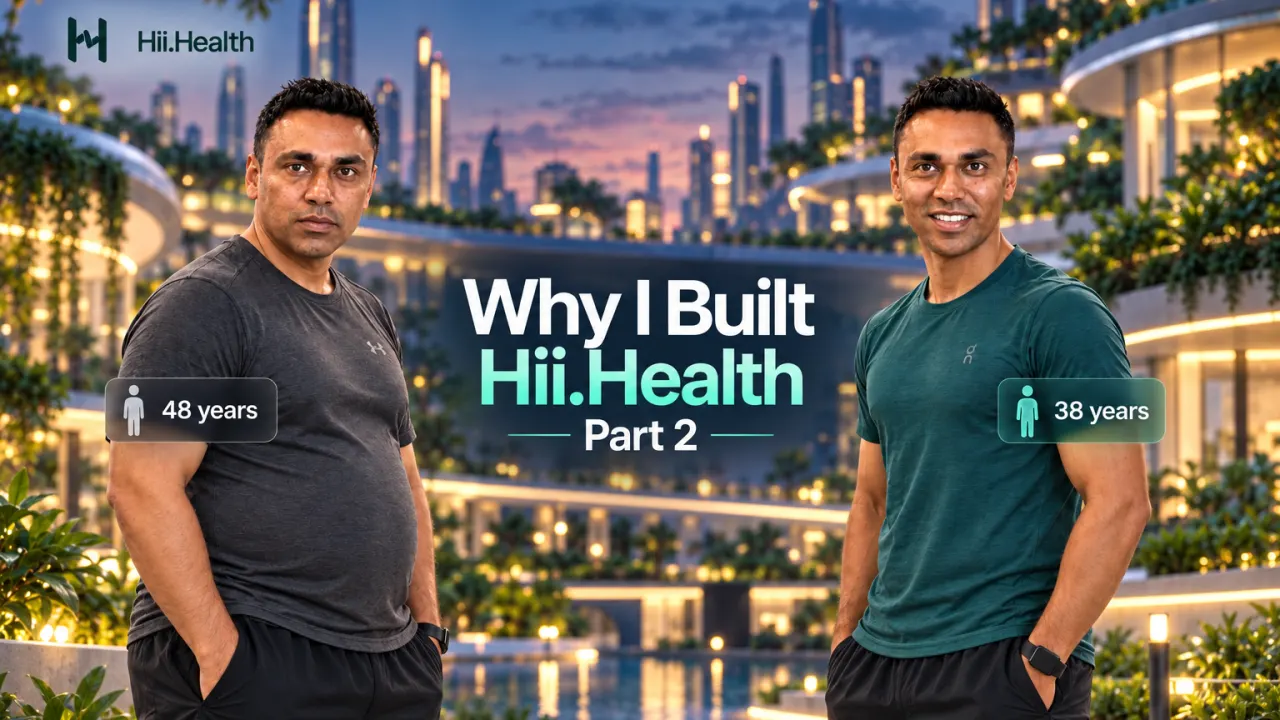
At the end of 2024, after a very stressful period trying to keep my first startup alive, I had reached around 96 kg, developed hypertension, pre-diabetes and hypercholesterolaemia, and my estimated biological age was around 48 years when I was chronologically 42. I decided to fix myself. I went back to running, gym, proper sleep and better food. Then I realised hydration was one of the biggest blind spots in my recovery. That question eventually led my team and me to start building a digital hydration biomarker.
And that was only the first problem. As hydration became a major part of my overall progress, my weight was reducing steadily and I was slowly getting fitter. Naturally, I started testing more and more data.
One of the most important biomarkers I started tracking, together with biological age, was high-sensitivity C-reactive protein, or hsCRP.
hsCRP is a blood marker commonly used to measure low-grade systemic inflammation. It is not a perfect marker, and it can be influenced by infection, exercise, injury, obesity and many other factors, but it is still a very useful window into chronic inflammatory state.
I had already written a full post about my hsCRP data and compared it with Singapore population data. One thing really caught my attention. In Singapore population studies, the three major ethnic groups showed different average hsCRP distributions. Those differences also broadly followed known population differences in cardiometabolic risk and life expectancy.
That does not mean hsCRP alone determines how long someone lives. Biology is obviously much more complicated than that. But higher hsCRP is consistently associated with higher cardiovascular and metabolic risk, so to me the direction was obvious:
I wanted mine lower. Given my South Asian background and my own metabolic situation at the time, it was not particularly surprising that my hsCRP started above 1.5 mg/L. So this became my next problem.
What was actually making my inflammation go up?
As a physician, I have a deep understanding of inflammation. But there was still a very practical problem. I could measure hsCRP with a blood test. Great. But I could not do a blood test every morning, after every meal, after exercise, after a bad night of sleep or after a stressful day. So I started asking the same kind of question that led us to hydration.
Can I track inflammation every day without taking blood?
And more specifically:
Can I see how food, hydration, exercise, sleep and other daily behaviours are affecting my inflammatory state?
By this point, my team already had thousands of data points and a deep understanding of inflammation. And we already knew that rPPG signals carry much more physiological information than just heart rate. So we started digging deeper. We looked at rPPG waveforms across multiple channels and tried to identify parts of the signal that behaved differently in people with higher inflammatory states.
We trained models to separate groups where inflammation was more likely to be present from groups where it was less likely. This time, because of everything we had learned during the hydration work, we were much faster. We started isolating signals that appeared to relate to inflammation at different levels. And an important distinction started emerging.
There seemed to be a difference between what I would call baseline or low-grade inflammatory state and the much more obvious inflammatory response you see when someone is clinically unwell.
In other words, we were beginning to see a potential difference between the kind of inflammation that may track with something like hsCRP in an otherwise well person and the stronger inflammatory physiology you see during infection or acute illness.
To be clear, this is still research. I am not saying a camera replaces hsCRP or CRP today. But the signal was interesting enough that I immediately started using it on myself.
Classic N=1 experiment 😂
And almost immediately, I started noticing patterns. When I slept well and stayed properly hydrated throughout the day, the inflammation-related digital marker often moved in a better direction. One of my team members noticed something similar from the opposite side. Poor sleep pushed his marker up. Smoking pushed it up even more. And then something even more interesting appeared.
It wasn’t only whether a behaviour changed the marker. We could start seeing how much it changed it and roughly how long the effect lasted. That led us to another idea.
We started building a mathematical concept I called “inflammation load.”
Think about smoking one cigarette versus smoking an entire pack. The biological effect is not simply “smoking: yes or no. There is dose. There is duration. There is recovery.
So instead of thinking only about whether inflammation was present, we started thinking about how much inflammatory burden a person accumulates over time. When we combined this idea with the digital biomarker, the data became much more useful to me personally. Suddenly, I could start connecting my own physiology with my daily behaviours.
And that was exactly what I wanted. The outcome was very clear. I wanted to reduce my hsCRP, and now I had a much better idea of which behaviours were probably doing the most damage to me.
So I started fixing them. Exercise, Better food, Proper sleep and most importantly Consistent hydration through my hydration protocol. And most importantly, consistency.
Over roughly 12 months, my hsCRP fell from above 1.5 mg/L to 0.39 mg/L.
Based on the Singapore population data I had been comparing myself against, that moved me into a very low-inflammatory range. I was super happy. And I have actually shared much of this openly. My blood tests, my hsCRP results, my interventions and the changes over time are all things I have posted publicly before because I want people to be able to look at the data, question it and experiment for themselves.
Yes, it is N=1. But it is still data.
And now we are trying to make this much more useful than my personal experiment. We are developing digital inflammation biomarkers aimed at tracking low-grade inflammation when someone is otherwise well, as well as different biomarkers designed for acute illness. And soon, we will be sharing something I think is incredibly exciting.
We have been studying whether these digital physiological signals can help detect complications in dengue patients, potentially before advanced testing is available. That work deserves its own article. COMING SOON ;)
But while all of this was happening, my mind went somewhere even crazier.
Can a camera tell us something about biological ageing?
By this stage, my weight was coming down, my hsCRP was improving, my fitness was getting better and overall I felt dramatically healthier. So I repeated my biological-age testing. And I got a result that genuinely surprised me.
My estimated biological age, which had previously been around 48, came back at around 38. In other words, the estimate had moved by roughly 10 years.
Now, I want to be careful here. I did not literally reverse the clock by ten years. Biological-age tests have measurement variability, different algorithms can produce different estimates, and epigenetic ageing is far more complicated than a single number.
But directionally, the result matched everything else I was seeing.
Lower weight.
Better metabolic health.
Much better fitness.
Lower inflammation.
Better sleep.
Better recovery.
So naturally my brain asked the next stupid question 😂
If we can detect physiological signals associated with inflammation, could rPPG also carry information related to biological ageing?
At first, even to me, this sounded a little crazy. But then we started connecting some dots. Inflammation is closely linked to ageing biology. Vascular function changes with age. Autonomic function changes with age. Microcirculation changes. Cardiovascular dynamics change. All of those things can influence optical physiological signals.
So perhaps rPPG does not need to “read genes” directly. Maybe what it can do is measure the physiological consequences of biological ageing.
That is a much more interesting and scientifically plausible question. We started pairing our inflammation-related digital signals and mathematical models with epigenetic biological-age data from a small group of more than ten people. And surprisingly, the early relationships made biological sense.
Again, this is a tiny dataset. I am absolutely not claiming that we have built a validated epigenetic clock from a camera.
Not yet 😂
But the signal was interesting enough to keep going.
And when I started looking deeper into the literature, I realised there is already a growing body of research trying to estimate biological age using non-invasive physiological, vascular, imaging and wearable measurements. That made the question even more exciting. Maybe we can eventually build something much more practical:
A simple, repeatable digital biomarker that tells you whether your physiological ageing trajectory appears to be moving in the right direction between expensive laboratory tests. Imagine being able to see how your ageing trajectory responds to sleep, exercise, weight loss, hydration, metabolic health and other interventions.
That is where my mind is now. But I’m going to stop there because this part definitely needs a lot more experiments.
So why am I building Hii.Health?
Because I learned something very simple from this whole journey. If you ask a crazy question, you might occasionally find an answer that science has not properly explored yet. If you only ask safe, boring questions, you are probably not going to push science very far.
That is what I do with my team at Hii.Health.
We ask questions like:
Can a phone camera measure hydration?
Can it help us understand inflammation?
Can vascular signals tell us when a dengue patient is beginning to deteriorate?
Can digital physiology tell us something about how fast we are ageing?
Some of those questions will fail.
Actually, many probably will.
That is science.
But occasionally one works.
And when it works, it can open an entirely new way of understanding the human body.
If you go through my feed, you will find many of my tests, epigenetic-age results and blood-test data already shared openly in previous posts. So this is not just a motivational story. It is still an N=1 experiment, and I know exactly what that means scientifically.
But it is an experiment backed by real data. And those experiments ultimately became part of the reason I started Hii.Health.
So join me in asking crazy questions.
Because maybe the next big step in understanding human physiology starts with a question that initially sounds ridiculous.
Let’s push how we measure and understand the human body to the next level.
Let’s go, Hii.Health. 🚀
You finished · 8 min read
Originally published on LinkedIn by Dr Yudara Kularathne MD, FAMS(EM).